Data Cleaning
The first step in our project is to clean the ANES survey data. Our primary question of interest is the relationship between authoritarianism and voting behavior, so we first isolate only the variables of interest into a new dataset.
The included variables are:
V202065x, combined data of the two the respondents party of registration where 1 = Democrat, 2= Republican, 4 = None or ‘independent’ and 5 = ‘Other’.
V201014b, taken before the election, of 56 possible options, the state of a respondent’s voter registration. Full variable guide is available at the above website.
V201502, taken before the election, a feeling thermometer indicating how financially secure the respondent felt in the past year.
V201458x, taken before the election, a respondents self-identified religion.
V202117, taken after the election, how respondent voted where 1 = in person, 2 = by mail or absentee ballot.
V202073, taken after the election, who the respondent voted for in the presidential election.
These variable can be studied along side the below authoritarian measures to examine possible relationships between authoritarian values and electoral behavior.
In the following variables, a ‘3’ response indicates a “both” answer:
*V202266, whether the respondent values, in children, independence or respect for elders.
V202267, in children, whether the respondent values curiosity or good manners more.
V202268, in children, whether the respondent values obedience or self-reliance more.
V202269, in children, whether the respondent values being considerate or well-behaved more.
The following answers are a feeling thermometer from 1 to 5:
V202270, how much the respondent agrees with the statement that, ‘The world would be a better place if people from other countries were more like Americans.’
V202273x, how much better or worse off the respondent feels the US is compared to other countries.
V202291, how often the respondent feels that women demanding equality want special favors.
V202292, how often the respondent feels that women complaining causes more problems than they solve.
The following answers are a feeling thermometer from 1 to 7:
V202276x, whether the respondent feels that rural areas get more or less from the government and to what degree.
V202279x, whether the respondent feels that people in rural areas have too much or too little influence, and to what degree.
V202282x, whether the respondent feels that people in rural areas get too much or too little respect, and to what degree.
V202286x, whether the respondent feels that it is easier or harder for a working mother to bond with her child, and to what degree.
V202290x, whether the respondent feels that it is better or worse if a man works and a woman takes care of the home, and to what degree.
Next, we convert all values below 0 to “NA”s. The survey data is coded such that negative values correspond to some non-answer (eg. -9 = Refused (in some cases “refuse to answer” is a possible selection answer, in which case there is a positive “refuse” value), -8 = don’t know, -1 = inapplicable, etc.).
The cleaning code can be found here: load_and_clean_data.R
source(here::here("static", "load_and_clean_data.R"), echo=FALSE)## ── Attaching packages ─────────────────────────────────────── tidyverse 1.3.1 ──## ✓ ggplot2 3.3.5 ✓ purrr 0.3.4
## ✓ tibble 3.1.6 ✓ dplyr 1.0.7
## ✓ tidyr 1.1.3 ✓ stringr 1.4.0
## ✓ readr 2.0.1 ✓ forcats 0.5.1## ── Conflicts ────────────────────────────────────────── tidyverse_conflicts() ──
## x dplyr::filter() masks stats::filter()
## x dplyr::lag() masks stats::lag()#Exploratory Analysis
We’ll now do some basic analysis of the data. First, we’d like to aggregate our respondent’s “authoritarian” score. To do so we will assign points to each response where one is most authoritarian and 0 is least and will average across each row.
First, let’s look at average scores nation wide.
ggplot(data=ANES_sum,aes(score,after_stat(density)))+
  geom_histogram(binwidth=.03,fill="orchid",color="black")+
  geom_density(color="blue",size=1)+
  labs(title = "Authoritarian Score Histogram",x="Score",y="Density")
## Warning: Removed 871 rows containing non-finite values (stat_bin).## Warning: Removed 871 rows containing non-finite values (stat_density).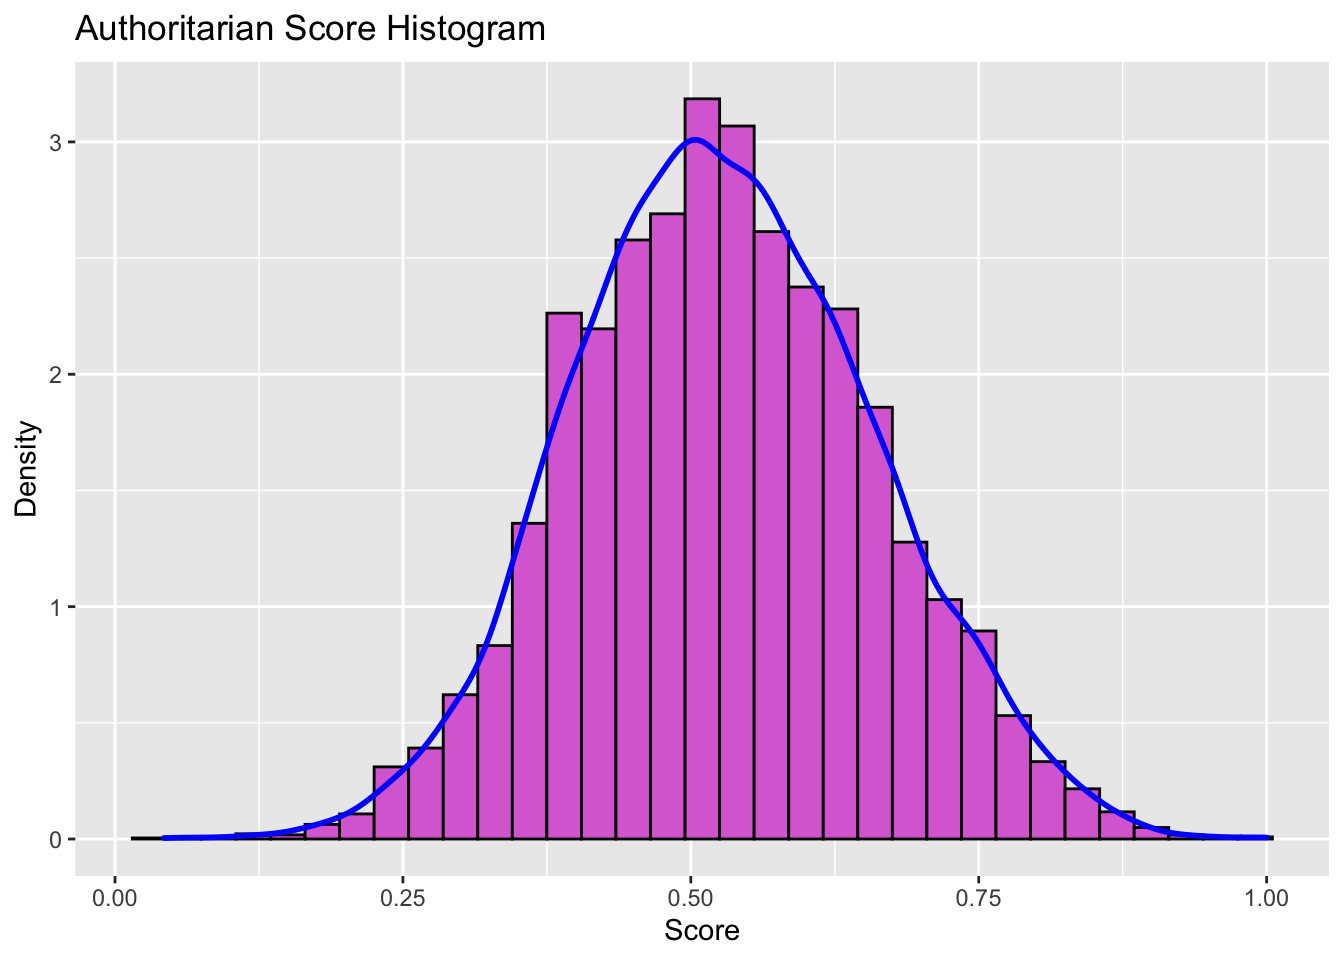 The mean authoritarianism in the United States, based on ANES survey is 0.5288536.
Next, let’s examine the score by party and by state.
ggplot(data=subset(ANES_sum,!(is.na(party))),aes(x=score,y = after_stat(density),fill=party))+
  geom_histogram(binwidth=0.03,alpha=0.75)+
  scale_fill_manual(values=c("blue","purple","red"),name="Party")+
  labs(title="Authoritarian Score by Party",x="Score",y="Density")
## Warning: Removed 439 rows containing non-finite values (stat_bin).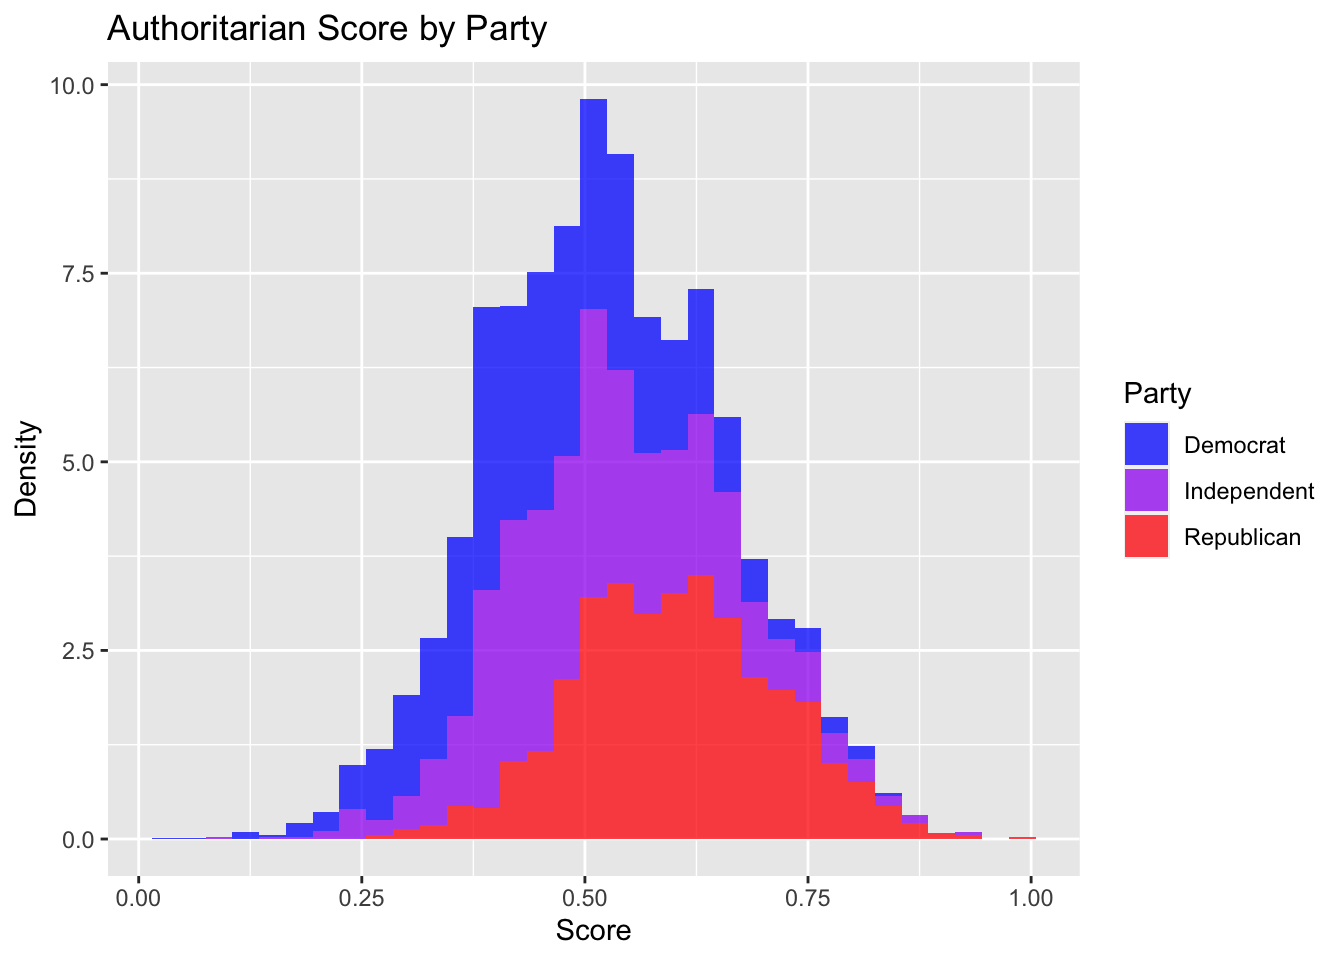
The differences in mean are distinct. For Republicans it’s 0.6011288, for Democrats it’s 0.4665472, and for independents it’s 0.5129676.
ANES_state<-ANES_sum%>%
group_by(state)%>%
summarize(average=mean(score,na.rm=TRUE))
 plot_usmap(regions="state",data=ANES_state,values="average")+
  scale_fill_continuous(low="palegreen",high="tomato",name="Authoritarianism")+
  theme(legend.position = "right")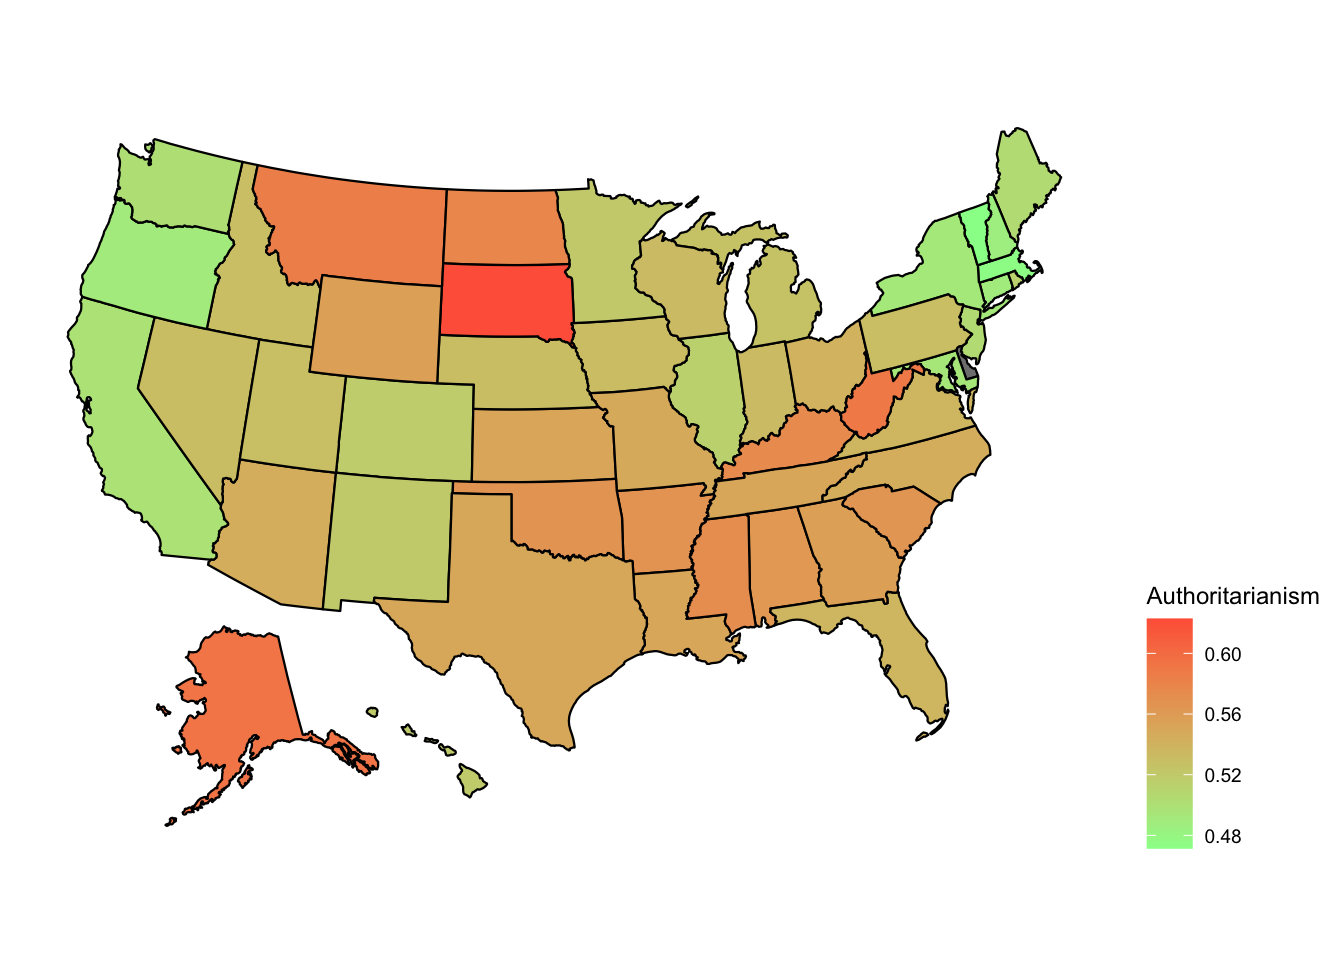
At the state level, most of the country seems around the average, however, South Dakota appears significantly more authoritarian, while Vermont and Massachusetts are significantly less so. Traditionally “Red” states appear to be more authoritarian than traditionally “blue” ones, while “purple” states appear to be in the middle, fitting with the partisan breakdown above.
Overall, moving forward, we can do more complex state and party analysis. Perhaps joinng with at state electoral results and turnout in the 2020 election to determine how Democratic/Republican different states are and comparing that to authoritarianism. Further, looking at individual level data from the ANES survey will be incredibly valuable in further, inferential analysis.