source(here::here("static", "load_and_clean_data.R"), echo=FALSE)## ── Attaching packages ─────────────────────────────────────── tidyverse 1.3.1 ──## ✓ ggplot2 3.3.5 ✓ purrr 0.3.4
## ✓ tibble 3.1.6 ✓ dplyr 1.0.7
## ✓ tidyr 1.1.3 ✓ stringr 1.4.0
## ✓ readr 2.0.1 ✓ forcats 0.5.1## ── Conflicts ────────────────────────────────────────── tidyverse_conflicts() ──
## x dplyr::filter() masks stats::filter()
## x dplyr::lag() masks stats::lag()First, a quick note on blog post #2: a few variables were improperly coded. I’ve corrected them and adjust the analysis, which is now much more in line with theory.
Possible Goals
Future goals for this project likely fall into one of three categories: understanding regional relationships between authoritarianism and its indicators, breaking down the aggregate score to examine more micro-level beliefs and how they relate to on another, and exploring how socio-demographic traits and voting behavior correlate with authoritarianism. Our previous post touched briefly on the first and last of those questions. In this post we will present three models:
The relationship between the four authoritarian categories: child rearing beliefs, beliefs on women, foreign relations, and rural areas.
A comprehensive model of voting behavior on aggregated scores, including state-level fixed effects.
A state-level examination of each of the four primary authoritarian indicator classifications.
Model 1
m1.a<- lm(child_score~women_score+foreign_score+rural_score, data=ANES_normalized)
m1.b<- lm(women_score~child_score+foreign_score+rural_score, data=ANES_normalized)
m1.c<- lm(foreign_score~women_score+child_score+rural_score, data=ANES_normalized)
m1.d<- lm(rural_score~women_score+foreign_score+child_score, data=ANES_normalized)

m1.a%>%broom::tidy()%>%knitr::kable(format="markdown")| term | estimate | std.error | statistic | p.value |
|---|---|---|---|---|
| (Intercept) | 0.2746598 | 0.0103393 | 26.564610 | 0 |
| women_score | 0.2396386 | 0.0176517 | 13.575942 | 0 |
| foreign_score | 0.1170959 | 0.0114971 | 10.184827 | 0 |
| rural_score | 0.1226056 | 0.0127359 | 9.626782 | 0 |
m1.b%>%broom::tidy()%>%knitr::kable(format="markdown")| term | estimate | std.error | statistic | p.value |
|---|---|---|---|---|
| (Intercept) | 0.2237693 | 0.0066723 | 33.53695 | 0 |
| child_score | 0.1051358 | 0.0077443 | 13.57594 | 0 |
| foreign_score | 0.1778792 | 0.0073756 | 24.11742 | 0 |
| rural_score | 0.1294133 | 0.0083510 | 15.49677 | 0 |
m1.c%>%broom::tidy()%>%knitr::kable(format="markdown")| term | estimate | std.error | statistic | p.value |
|---|---|---|---|---|
| (Intercept) | 0.1739112 | 0.0108906 | 15.968865 | 0 |
| women_score | 0.4239677 | 0.0175793 | 24.117416 | 0 |
| child_score | 0.1224456 | 0.0120224 | 10.184827 | 0 |
| rural_score | 0.1144850 | 0.0130376 | 8.781124 | 0 |
m1.d%>%broom::tidy()%>%knitr::kable(format="markdown")| term | estimate | std.error | statistic | p.value |
|---|---|---|---|---|
| (Intercept) | 0.4363579 | 0.0085769 | 50.875929 | 0 |
| women_score | 0.2517494 | 0.0162453 | 15.496771 | 0 |
| foreign_score | 0.0934395 | 0.0106409 | 8.781124 | 0 |
| child_score | 0.1046391 | 0.0108696 | 9.626782 | 0 |
From these models, we see strong, positive correlations between all four categories, indicating that authoritarian beliefs are intrapersonally consistent.
Model 2
Next, let us examine the Voting Behavior + Demographics model:
ANES_normalized<-ANES_normalized%>%
  mutate(Religious = ifelse(Religion != "Not Religious"&!is.na(Religion),1,ifelse(!is.na(Religion),0,NA)))
m2<-lm(score ~ party + Religious +  President, data=ANES_normalized,na.rm=TRUE)
## Warning: In lm.fit(x, y, offset = offset, singular.ok = singular.ok, ...) :
## extra argument 'na.rm' will be disregardedm2%>%broom::tidy()%>%knitr::kable(format="markdown")| term | estimate | std.error | statistic | p.value |
|---|---|---|---|---|
| (Intercept) | 0.4149697 | 0.0043336 | 95.7572284 | 0.0000000 |
| partyIndependent | 0.0109150 | 0.0051331 | 2.1263948 | 0.0335451 |
| partyRepublican | 0.0379816 | 0.0060109 | 6.3188195 | 0.0000000 |
| Religious | 0.0508229 | 0.0046833 | 10.8518221 | 0.0000000 |
| PresidentDon’t Know | 0.1651147 | 0.1090407 | 1.5142477 | 0.1300597 |
| PresidentHawkins | 0.0347841 | 0.0329783 | 1.0547571 | 0.2916144 |
| PresidentJorgensen | 0.0735578 | 0.0196078 | 3.7514544 | 0.0001789 |
| PresidentOther | 0.0520168 | 0.0216120 | 2.4068478 | 0.0161460 |
| PresidentRefused | 0.0751292 | 0.0386749 | 1.9425808 | 0.0521526 |
| PresidentRepublican | -0.0146815 | 0.1089366 | -0.1347707 | 0.8928015 |
| PresidentTrump | 0.1228143 | 0.0053937 | 22.7697485 | 0.0000000 |
From this we see That for a non-religious, democratic, Biden voter, the average authoritarianism is 0.414. Holding ass other factors the same, Republicans are 0.038 points more authoritarian, which is statistically significant, Religious people are a statistically significant 0.051 points more authoritarian, and Trump voters are 0.1228143 statistically significant points more authoritarian. Interestingly, Jorgensen voters (the libertarian candidate) have a statistically significant increase in authoritarianism over Biden voters of 0.074 points, a (very unsurprising) oxymoronical twist on a group whose name is eponymous from the literal antithesis of authoritarianism.
Model 3
In our third and final model, we explore state-level divisions in authoritarian traits.
m3<-lm(cbind(child_score,women_score,foreign_score,rural_score)~state,data=ANES_normalized)
m3%>%broom::tidy()%>%knitr::kable(format="markdown")| response | term | estimate | std.error | statistic | p.value |
|---|---|---|---|---|---|
| child_score | (Intercept) | 0.5798969 | 0.0224814 | 25.7945063 | 0.0000000 |
| child_score | statealaska | 0.0138531 | 0.0814467 | 0.1700879 | 0.8649463 |
| child_score | statearizona | -0.0671232 | 0.0293813 | -2.2845535 | 0.0223712 |
| child_score | statearkansas | 0.0051031 | 0.0385476 | 0.1323842 | 0.8946845 |
| child_score | statecalifornia | -0.0979946 | 0.0242476 | -4.0414066 | 0.0000537 |
| child_score | statecelaware | -0.0414354 | 0.0653956 | -0.6336114 | 0.5263568 |
| child_score | statecolorado | -0.1055818 | 0.0290035 | -3.6403148 | 0.0002744 |
| child_score | stateconnecticut | -0.0995398 | 0.0347242 | -2.8665784 | 0.0041627 |
| child_score | stateflorida | -0.0392719 | 0.0250595 | -1.5671488 | 0.1171287 |
| child_score | stategeorgia | -0.0399754 | 0.0276060 | -1.4480719 | 0.1476452 |
| child_score | statehawaii | -0.0298969 | 0.0496631 | -0.6019949 | 0.5471986 |
| child_score | stateidaho | -0.1071696 | 0.0373735 | -2.8675284 | 0.0041502 |
| child_score | stateillinois | -0.0709041 | 0.0261106 | -2.7155297 | 0.0066345 |
| child_score | stateindiana | -0.0845553 | 0.0284591 | -2.9711208 | 0.0029780 |
| child_score | stateiowa | -0.0579671 | 0.0369527 | -1.5686821 | 0.1167708 |
| child_score | statekansas | -0.0711760 | 0.0327944 | -2.1703688 | 0.0300151 |
| child_score | statekentucky | -0.0764565 | 0.0309061 | -2.4738349 | 0.0133925 |
| child_score | statelouisiana | -0.0270123 | 0.0336740 | -0.8021695 | 0.4224843 |
| child_score | statemaine | -0.0991277 | 0.0488978 | -2.0272414 | 0.0426785 |
| child_score | statemaryland | -0.0719855 | 0.0285605 | -2.5204611 | 0.0117439 |
| child_score | statemassachusetts | -0.1187689 | 0.0283610 | -4.1877494 | 0.0000285 |
| child_score | statemichigan | -0.0539823 | 0.0265462 | -2.0335183 | 0.0420408 |
| child_score | stateminnesota | -0.0916419 | 0.0288867 | -3.1724586 | 0.0015186 |
| child_score | statemississippi | 0.0351825 | 0.0358272 | 0.9820032 | 0.3261349 |
| child_score | statemissouri | -0.0575755 | 0.0292505 | -1.9683568 | 0.0490695 |
| child_score | statemontana | -0.0404232 | 0.0555489 | -0.7277047 | 0.4668206 |
| child_score | statenebraska | -0.0354525 | 0.0399357 | -0.8877382 | 0.3747145 |
| child_score | statenevada | -0.1105092 | 0.0388063 | -2.8477135 | 0.0044173 |
| child_score | statenew hampshire | -0.0736469 | 0.0416058 | -1.7701116 | 0.0767555 |
| child_score | statenew jersey | -0.0598352 | 0.0284260 | -2.1049445 | 0.0353345 |
| child_score | statenew mexico | -0.0907665 | 0.0396381 | -2.2898803 | 0.0220602 |
| child_score | statenew york | -0.0806831 | 0.0256823 | -3.1415817 | 0.0016879 |
| child_score | statenorth carolina | -0.0376672 | 0.0269490 | -1.3977215 | 0.1622445 |
| child_score | statenorth dakota | -0.0986469 | 0.0543753 | -1.8141867 | 0.0696952 |
| child_score | stateohio | -0.0445195 | 0.0262757 | -1.6943215 | 0.0902522 |
| child_score | stateoklahoma | 0.0005629 | 0.0326944 | 0.0172159 | 0.9862649 |
| child_score | stateoregon | -0.1206578 | 0.0322226 | -3.7445080 | 0.0001823 |
| child_score | statepennsylvania | -0.0398613 | 0.0260745 | -1.5287461 | 0.1263761 |
| child_score | staterhode island | -0.0632302 | 0.0614309 | -1.0292903 | 0.3033816 |
| child_score | statesouth carolina | -0.0067837 | 0.0311113 | -0.2180459 | 0.8274002 |
| child_score | statesouth dakota | 0.0138531 | 0.0597452 | 0.2318697 | 0.8166466 |
| child_score | statetennessee | -0.0482068 | 0.0291661 | -1.6528356 | 0.0984127 |
| child_score | statetexas | -0.0147870 | 0.0247621 | -0.5971634 | 0.5504191 |
| child_score | stateutah | -0.1048969 | 0.0347242 | -3.0208551 | 0.0025304 |
| child_score | statevermont | -0.1923969 | 0.0543753 | -3.5383157 | 0.0004055 |
| child_score | statevirginia | -0.0522023 | 0.0282662 | -1.8468104 | 0.0648201 |
| child_score | statewashington | -0.1341138 | 0.0282975 | -4.7394286 | 0.0000022 |
| child_score | statewashington dc | -0.1493414 | 0.0432114 | -3.4560653 | 0.0005516 |
| child_score | statewest virginia | 0.0013531 | 0.0416058 | 0.0325217 | 0.9740570 |
| child_score | statewisconsin | -0.0406812 | 0.0287374 | -1.4156181 | 0.1569353 |
| child_score | statewyoming | -0.0084683 | 0.0866545 | -0.0977253 | 0.9221535 |
| women_score | (Intercept) | 0.4802577 | 0.0155914 | 30.8028273 | 0.0000000 |
| women_score | statealaska | 0.0278673 | 0.0564850 | 0.4933566 | 0.6217773 |
| women_score | statearizona | -0.0202942 | 0.0203766 | -0.9959582 | 0.3193076 |
| women_score | statearkansas | -0.0132577 | 0.0267336 | -0.4959202 | 0.6199675 |
| women_score | statecalifornia | -0.0446096 | 0.0168163 | -2.6527638 | 0.0080030 |
| women_score | statecelaware | -0.0342962 | 0.0453533 | -0.7562014 | 0.4495559 |
| women_score | statecolorado | -0.0433057 | 0.0201146 | -2.1529520 | 0.0313592 |
| women_score | stateconnecticut | -0.0865434 | 0.0240820 | -3.5936947 | 0.0003284 |
| women_score | stateflorida | -0.0152015 | 0.0173793 | -0.8746896 | 0.3817752 |
| women_score | stategeorgia | -0.0039227 | 0.0191454 | -0.2048880 | 0.8376660 |
| women_score | statehawaii | -0.0045577 | 0.0344424 | -0.1323290 | 0.8947282 |
| women_score | stateidaho | -0.0211668 | 0.0259194 | -0.8166415 | 0.4141633 |
| women_score | stateillinois | -0.0406444 | 0.0181083 | -2.2445224 | 0.0248324 |
| women_score | stateindiana | -0.0283012 | 0.0197370 | -1.4339180 | 0.1516439 |
| women_score | stateiowa | -0.0366174 | 0.0256275 | -1.4288300 | 0.1531012 |
| women_score | statekansas | -0.0170601 | 0.0227436 | -0.7501021 | 0.4532204 |
| women_score | statekentucky | 0.0217606 | 0.0214340 | 1.0152361 | 0.3100311 |
| women_score | statelouisiana | -0.0279821 | 0.0233537 | -1.1981871 | 0.2308879 |
| women_score | statemaine | -0.0570847 | 0.0339117 | -1.6833317 | 0.0923590 |
| women_score | statemaryland | -0.0781375 | 0.0198073 | -3.9448824 | 0.0000807 |
| women_score | statemassachusetts | -0.0820565 | 0.0196690 | -4.1718717 | 0.0000306 |
| women_score | statemichigan | -0.0353898 | 0.0184104 | -1.9222744 | 0.0546150 |
| women_score | stateminnesota | -0.0575564 | 0.0200336 | -2.8729981 | 0.0040792 |
| women_score | statemississippi | 0.0130359 | 0.0248470 | 0.5246482 | 0.5998457 |
| women_score | statemissouri | -0.0176863 | 0.0202859 | -0.8718527 | 0.3833210 |
| women_score | statemontana | 0.0054002 | 0.0385244 | 0.1401751 | 0.8885260 |
| women_score | statenebraska | -0.0360911 | 0.0276963 | -1.3031008 | 0.1925866 |
| women_score | statenevada | 0.0202015 | 0.0269130 | 0.7506205 | 0.4529083 |
| women_score | statenew hampshire | -0.0682577 | 0.0288545 | -2.3655808 | 0.0180311 |
| women_score | statenew jersey | -0.0541158 | 0.0197141 | -2.7450330 | 0.0060671 |
| women_score | statenew mexico | -0.0596056 | 0.0274899 | -2.1682725 | 0.0301742 |
| women_score | statenew york | -0.0643065 | 0.0178112 | -3.6104424 | 0.0003080 |
| women_score | statenorth carolina | -0.0328703 | 0.0186897 | -1.7587399 | 0.0786688 |
| women_score | statenorth dakota | 0.0538673 | 0.0377105 | 1.4284440 | 0.1532122 |
| women_score | stateohio | -0.0135030 | 0.0182228 | -0.7409956 | 0.4587229 |
| women_score | stateoklahoma | -0.0111485 | 0.0226743 | -0.4916825 | 0.6229604 |
| women_score | stateoregon | -0.0465621 | 0.0223471 | -2.0835868 | 0.0372368 |
| women_score | statepennsylvania | -0.0333182 | 0.0180833 | -1.8424911 | 0.0654489 |
| women_score | staterhode island | -0.0710911 | 0.0426037 | -1.6686600 | 0.0952330 |
| women_score | statesouth carolina | -0.0098804 | 0.0215764 | -0.4579251 | 0.6470216 |
| women_score | statesouth dakota | 0.0475548 | 0.0414346 | 1.1477071 | 0.2511318 |
| women_score | statetennessee | -0.0190077 | 0.0202273 | -0.9397054 | 0.3474037 |
| women_score | statetexas | 0.0024291 | 0.0171731 | 0.1414472 | 0.8875210 |
| women_score | stateutah | -0.0120792 | 0.0240820 | -0.5015841 | 0.6159771 |
| women_score | statevermont | -0.1432577 | 0.0377105 | -3.7988868 | 0.0001467 |
| women_score | statevirginia | -0.0397937 | 0.0196032 | -2.0299548 | 0.0424018 |
| women_score | statewashington | -0.0521704 | 0.0196249 | -2.6583760 | 0.0078711 |
| women_score | statewashington dc | -0.1102577 | 0.0299680 | -3.6791772 | 0.0002359 |
| women_score | statewest virginia | 0.0303673 | 0.0288545 | 1.0524262 | 0.2926432 |
| women_score | statewisconsin | -0.0457643 | 0.0199300 | -2.2962462 | 0.0216935 |
| women_score | statewyoming | -0.0399006 | 0.0600968 | -0.6639385 | 0.5067532 |
| foreign_score | (Intercept) | 0.5979381 | 0.0237762 | 25.1486515 | 0.0000000 |
| foreign_score | statealaska | -0.0823131 | 0.0861373 | -0.9556040 | 0.3393079 |
| foreign_score | statearizona | -0.0550549 | 0.0310734 | -1.7717687 | 0.0764799 |
| foreign_score | statearkansas | -0.0429381 | 0.0407676 | -1.0532417 | 0.2922694 |
| foreign_score | statecalifornia | -0.1383422 | 0.0256441 | -5.3946997 | 0.0000001 |
| foreign_score | statecelaware | -0.0210151 | 0.0691618 | -0.3038537 | 0.7612491 |
| foreign_score | statecolorado | -0.1279039 | 0.0306738 | -4.1698028 | 0.0000309 |
| foreign_score | stateconnecticut | -0.1193667 | 0.0367241 | -3.2503675 | 0.0011584 |
| foreign_score | stateflorida | -0.0741881 | 0.0265027 | -2.7992698 | 0.0051370 |
| foreign_score | stategeorgia | -0.0488544 | 0.0291958 | -1.6733329 | 0.0943100 |
| foreign_score | statehawaii | -0.1779381 | 0.0525232 | -3.3877986 | 0.0007088 |
| foreign_score | stateidaho | -0.0956654 | 0.0395259 | -2.4203210 | 0.0155341 |
| foreign_score | stateillinois | -0.1136756 | 0.0276143 | -4.1165395 | 0.0000389 |
| foreign_score | stateindiana | -0.0994909 | 0.0300981 | -3.3055601 | 0.0009530 |
| foreign_score | stateiowa | -0.0584645 | 0.0390809 | -1.4959857 | 0.1347060 |
| foreign_score | statekansas | -0.0586940 | 0.0346831 | -1.6922929 | 0.0906382 |
| foreign_score | statekentucky | -0.0451859 | 0.0326860 | -1.3824217 | 0.1668898 |
| foreign_score | statelouisiana | -0.0498612 | 0.0356134 | -1.4000696 | 0.1615403 |
| foreign_score | statemaine | -0.1652458 | 0.0517139 | -3.1953842 | 0.0014031 |
| foreign_score | statemaryland | -0.1232546 | 0.0302053 | -4.0805625 | 0.0000455 |
| foreign_score | statemassachusetts | -0.1345235 | 0.0299944 | -4.4849572 | 0.0000074 |
| foreign_score | statemichigan | -0.0745642 | 0.0280751 | -2.6558838 | 0.0079294 |
| foreign_score | stateminnesota | -0.1021328 | 0.0305503 | -3.3430984 | 0.0008332 |
| foreign_score | statemississippi | -0.0542874 | 0.0378906 | -1.4327400 | 0.1519803 |
| foreign_score | statemissouri | -0.0970453 | 0.0309351 | -3.1370594 | 0.0017142 |
| foreign_score | statemontana | -0.0979381 | 0.0587481 | -1.6670864 | 0.0955455 |
| foreign_score | statenebraska | -0.0868270 | 0.0422357 | -2.0557746 | 0.0398442 |
| foreign_score | statenevada | -0.1234483 | 0.0410412 | -3.0079135 | 0.0026406 |
| foreign_score | statenew hampshire | -0.1573131 | 0.0440019 | -3.5751409 | 0.0003526 |
| foreign_score | statenew jersey | -0.0948517 | 0.0300631 | -3.1550867 | 0.0016118 |
| foreign_score | statenew mexico | -0.1115251 | 0.0419209 | -2.6603695 | 0.0078247 |
| foreign_score | statenew york | -0.1160199 | 0.0271614 | -4.2715005 | 0.0000197 |
| foreign_score | statenorth carolina | -0.0675327 | 0.0285010 | -2.3694849 | 0.0178420 |
| foreign_score | statenorth dakota | -0.0479381 | 0.0575068 | -0.8336077 | 0.4045328 |
| foreign_score | stateohio | -0.0644476 | 0.0277890 | -2.3191759 | 0.0204164 |
| foreign_score | stateoklahoma | -0.0375933 | 0.0345773 | -1.0872259 | 0.2769774 |
| foreign_score | stateoregon | -0.1903294 | 0.0340783 | -5.5850549 | 0.0000000 |
| foreign_score | statepennsylvania | -0.0734720 | 0.0275762 | -2.6643255 | 0.0077334 |
| foreign_score | staterhode island | -0.1146048 | 0.0649688 | -1.7639973 | 0.0777795 |
| foreign_score | statesouth carolina | -0.0519476 | 0.0329031 | -1.5788056 | 0.1144294 |
| foreign_score | statesouth dakota | -0.0041881 | 0.0631860 | -0.0662828 | 0.9471547 |
| foreign_score | statetennessee | -0.0389593 | 0.0308458 | -1.2630324 | 0.2066229 |
| foreign_score | statetexas | -0.0627733 | 0.0261882 | -2.3970088 | 0.0165576 |
| foreign_score | stateutah | -0.1354381 | 0.0367241 | -3.6879941 | 0.0002279 |
| foreign_score | statevermont | -0.1666881 | 0.0575068 | -2.8985795 | 0.0037611 |
| foreign_score | statevirginia | -0.0852136 | 0.0298941 | -2.8505167 | 0.0043786 |
| foreign_score | statewashington | -0.1649562 | 0.0299272 | -5.5119250 | 0.0000000 |
| foreign_score | statewashington dc | -0.1326604 | 0.0457000 | -2.9028531 | 0.0037103 |
| foreign_score | statewest virginia | -0.0198131 | 0.0440019 | -0.4502789 | 0.6525244 |
| foreign_score | statewisconsin | -0.0840493 | 0.0303925 | -2.7654641 | 0.0057003 |
| foreign_score | statewyoming | -0.1872239 | 0.0916451 | -2.0429229 | 0.0411004 |
| rural_score | (Intercept) | 0.6547938 | 0.0210081 | 31.1685892 | 0.0000000 |
| rural_score | statealaska | 0.1014562 | 0.0761092 | 1.3330347 | 0.1825672 |
| rural_score | statearizona | 0.0103522 | 0.0274559 | 0.3770478 | 0.7061504 |
| rural_score | statearkansas | 0.0726062 | 0.0360214 | 2.0156380 | 0.0438790 |
| rural_score | statecalifornia | -0.0510733 | 0.0226586 | -2.2540341 | 0.0242272 |
| rural_score | statecelaware | 0.0613600 | 0.0611100 | 1.0040920 | 0.3153717 |
| rural_score | statecolorado | 0.0025350 | 0.0271028 | 0.0935310 | 0.9254846 |
| rural_score | stateconnecticut | -0.0285081 | 0.0324487 | -0.8785604 | 0.3796722 |
| rural_score | stateflorida | -0.0058688 | 0.0234172 | -0.2506194 | 0.8021163 |
| rural_score | stategeorgia | 0.0132428 | 0.0257969 | 0.5133505 | 0.6077237 |
| rural_score | statehawaii | -0.0153938 | 0.0464085 | -0.3317026 | 0.7401245 |
| rural_score | stateidaho | 0.0142971 | 0.0349243 | 0.4093737 | 0.6822790 |
| rural_score | stateillinois | -0.0155492 | 0.0243995 | -0.6372762 | 0.5239675 |
| rural_score | stateindiana | 0.0000199 | 0.0265940 | 0.0007464 | 0.9994045 |
| rural_score | stateiowa | 0.0222237 | 0.0345311 | 0.6435860 | 0.5198667 |
| rural_score | statekansas | 0.0238108 | 0.0306453 | 0.7769819 | 0.4371978 |
| rural_score | statekentucky | 0.0638300 | 0.0288807 | 2.2101275 | 0.0271311 |
| rural_score | statelouisiana | 0.0420652 | 0.0314673 | 1.3367906 | 0.1813378 |
| rural_score | statemaine | -0.0028707 | 0.0456934 | -0.0628261 | 0.9499069 |
| rural_score | statemaryland | -0.0428951 | 0.0266888 | -1.6072318 | 0.1080522 |
| rural_score | statemassachusetts | -0.0698853 | 0.0265024 | -2.6369381 | 0.0083857 |
| rural_score | statemichigan | -0.0009117 | 0.0248066 | -0.0367524 | 0.9706836 |
| rural_score | stateminnesota | 0.0274545 | 0.0269937 | 1.0170723 | 0.3091570 |
| rural_score | statemississippi | 0.0555236 | 0.0334794 | 1.6584441 | 0.0972762 |
| rural_score | statemissouri | 0.0469562 | 0.0273336 | 1.7178895 | 0.0858645 |
| rural_score | statemontana | 0.1357325 | 0.0519086 | 2.6148347 | 0.0089477 |
| rural_score | statenebraska | 0.0178729 | 0.0373186 | 0.4789261 | 0.6320073 |
| rural_score | statenevada | -0.0029571 | 0.0362632 | -0.0815450 | 0.9350111 |
| rural_score | statenew hampshire | -0.0421688 | 0.0388792 | -1.0846102 | 0.2781346 |
| rural_score | statenew jersey | -0.0463062 | 0.0265632 | -1.7432472 | 0.0813378 |
| rural_score | statenew mexico | 0.0044453 | 0.0370405 | 0.1200124 | 0.9044770 |
| rural_score | statenew york | -0.0492278 | 0.0239993 | -2.0512203 | 0.0402856 |
| rural_score | statenorth carolina | 0.0455891 | 0.0251829 | 1.8103162 | 0.0702930 |
| rural_score | statenorth dakota | 0.0217062 | 0.0508119 | 0.4271871 | 0.6692572 |
| rural_score | stateohio | -0.0122844 | 0.0245538 | -0.5003046 | 0.6168776 |
| rural_score | stateoklahoma | 0.0552637 | 0.0305518 | 1.8088515 | 0.0705203 |
| rural_score | stateoregon | -0.0335982 | 0.0301109 | -1.1158122 | 0.2645438 |
| rural_score | statepennsylvania | -0.0138863 | 0.0243658 | -0.5699118 | 0.5687572 |
| rural_score | staterhode island | -0.0277938 | 0.0574051 | -0.4841694 | 0.6282820 |
| rural_score | statesouth carolina | 0.0656779 | 0.0290725 | 2.2591062 | 0.0239098 |
| rural_score | statesouth dakota | 0.1086437 | 0.0558299 | 1.9459776 | 0.0517005 |
| rural_score | statetennessee | 0.0128470 | 0.0272547 | 0.4713685 | 0.6373935 |
| rural_score | statetexas | 0.0026787 | 0.0231394 | 0.1157644 | 0.9078429 |
| rural_score | stateutah | 0.0165633 | 0.0324487 | 0.5104474 | 0.6097554 |
| rural_score | statevermont | -0.0127938 | 0.0508119 | -0.2517878 | 0.8012131 |
| rural_score | statevirginia | 0.0181703 | 0.0264138 | 0.6879073 | 0.4915357 |
| rural_score | statewashington | -0.0094022 | 0.0264430 | -0.3555662 | 0.7221770 |
| rural_score | statewashington dc | -0.1254883 | 0.0403796 | -3.1077144 | 0.0018936 |
| rural_score | statewest virginia | 0.0717062 | 0.0388792 | 1.8443312 | 0.0651804 |
| rural_score | statewisconsin | 0.0289317 | 0.0268542 | 1.0773626 | 0.2813584 |
| rural_score | statewyoming | 0.0073490 | 0.0809758 | 0.0907561 | 0.9276892 |
Perhaps a map would be more appeasing.
library(gridExtra)##
## Attaching package: 'gridExtra'## The following object is masked from 'package:dplyr':
##
## combineANES_state<- ANES_normalized%>%
group_by(state)%>%
dplyr::summarize(cs=mean(child_score,na.rm=TRUE),ws=mean(women_score,na.rm=TRUE),fs=mean(foreign_score,na.rm=TRUE),rs = mean(rural_score,na.rm=TRUE))
cs<-plot_usmap(data=ANES_state, regions = "states",values = "cs")+
scale_fill_continuous(low="palegreen",high="tomato",name="Authoritarian Child Rearing")+
theme(legend.position = "right",legend.title=element_text(size=5))
ws<-plot_usmap(data=ANES_state, regions = "states",values = "ws")+
scale_fill_continuous(low="palegreen",high="tomato",name="Authoritarian Views on Women")+
theme(legend.position = "right",legend.title=element_text(size=5))
fs<-plot_usmap(data=ANES_state, regions = "states",values = "fs")+
scale_fill_continuous(low="palegreen",high="tomato",name="Auhtoritarian Views on International Relations")+
theme(legend.position = "right",legend.title=element_text(size=5))
rs<-plot_usmap(data=ANES_state, regions = "states",values = "rs")+
scale_fill_continuous(low="palegreen",high="tomato",name="Authoritarian Views on Rural Areas")+
theme(legend.position = "right",legend.title=element_text(size=5))
grid.arrange(cs,ws,fs,rs,nrow=2)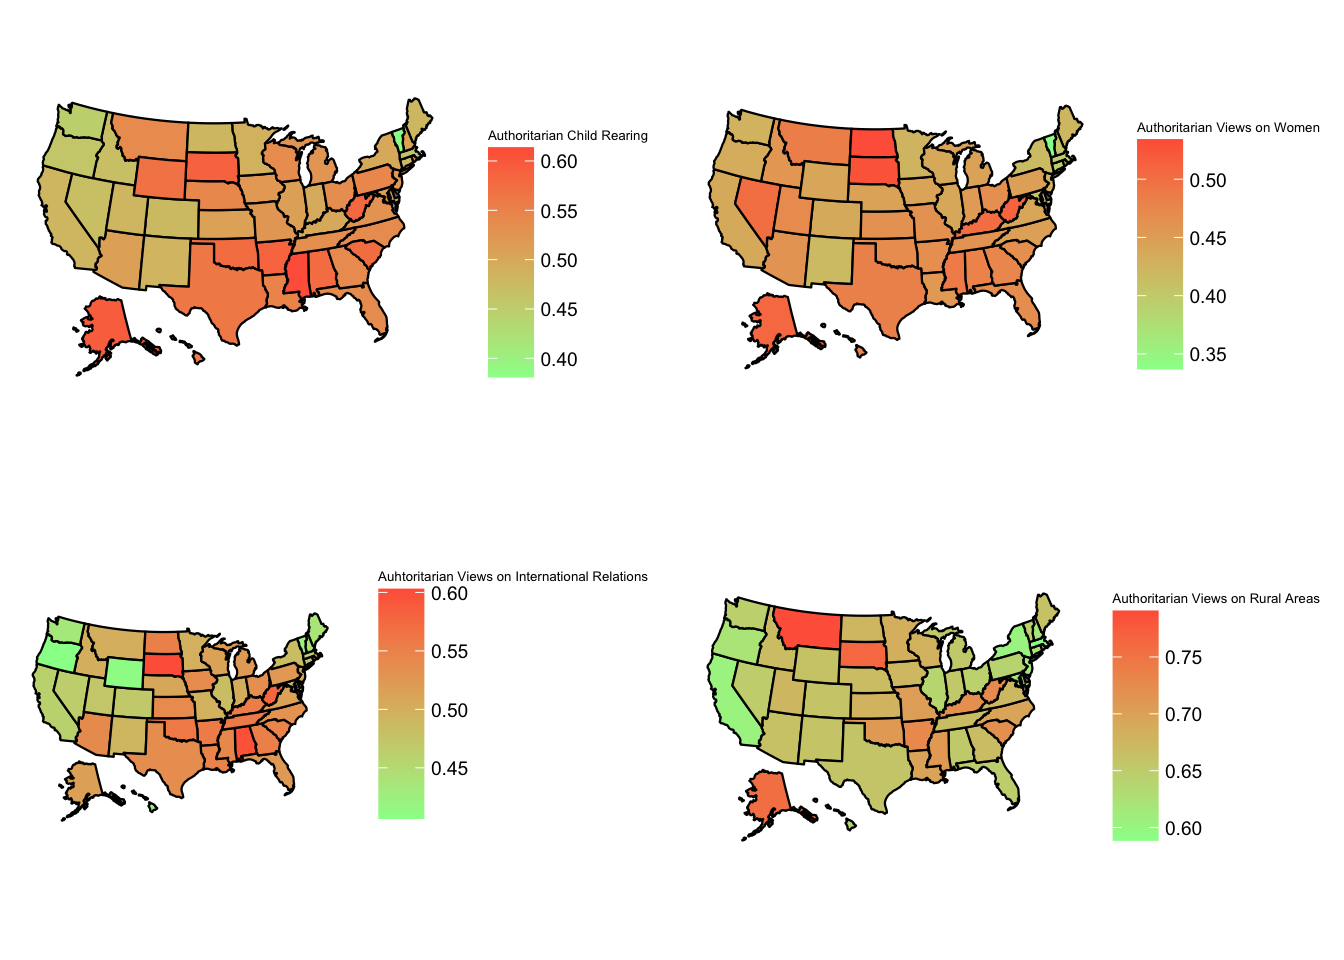
There we go!
From the plots we see that the views on women are the most authoritarian overall, while views on rural areas are the least. Child rearing is solidly average, while international relations is a mixed bag. The general trend of red-leaning states being more authoritarian and vice versa holds true, though this is certainly worth further analysis as we begin to introduce state-level panel data. Montana sticks out like a sore thumb on the rural areas plot, while Washington and Colorado have the most libertarian views on international relations.
Moving Forward
Panel data is the nectar and ambrosia of political research, and, as such, we expect to introduce ANES time-series data files in the future, while also providing state level electoral data across recent elections. Together, these can provide a more wholistic view of the rise and proliferation of authoritarian views in the United States.